...at least when I'm winning.
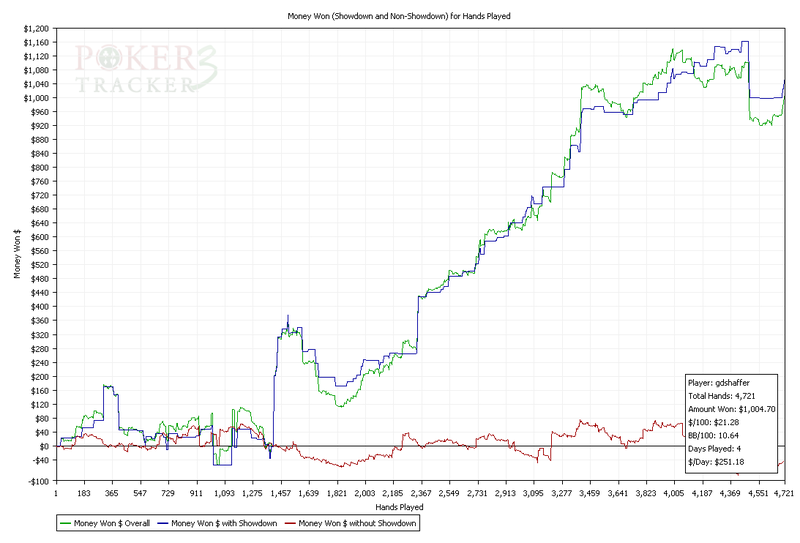
Here's the graph of my winnings, showdown winnings, and non-showdown winnings from 6-1 thru 6-6 when I was winning:
And here's the graph since 6-9, when I've also been winning:
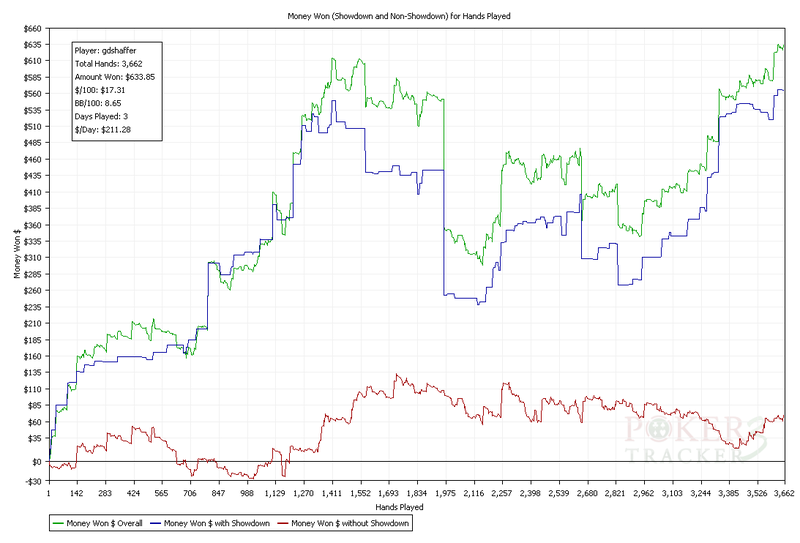
Looking at the graphs of other timeframes in which I was winning, my non-showdown winnings were still always negative. That often tends to indicate someone who's basically nutpedaling, though I don't think that's always the case. People at twoplustwo are always talking about how having a blue line above your green line means you're getting outplayed, but I don't think that's necessarily the case. By winning money at showdown you're getting your opponents to make bad calls; by losing it in non-showdown pots you may be making good laydowns.
Still, I can't say exactly what in my game has changed, but something obviously has. From my first 39k hands where I won at 2.82 PTBB/100 to my last 16k where I've won at 5.42 PTBB/100, my play has definitely improved. Granted, I've run a little over expectation in my last 16k, but not a ton.
Let's not even talk about that 3 month stretch, from February through April, where I played 48k hands of breakeven, including an almost $2k, 20 buy-in downswing. Some of that was bad luck, and a lot of it was bad luck perpetuating a subtle tilt, but I've realized that my play during that timeframe was decidedly off. I was too anxious to stack off with marginal hands, not content enough to win moderate pots with my overpairs but rather swinging for the fences every time.
During that losing timeframe I was playing a completely vanilla 13/10/2.6 style and postflop acted like I was peddling the nuts even when I didn't have the nuts. Not smart. My graph looked something like this:
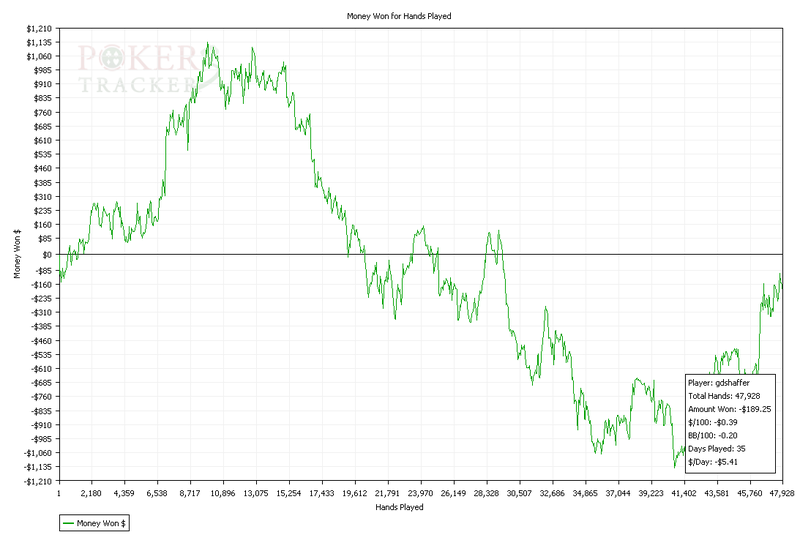
Filtering out all of my time at NL100 EXCEPT for those three months, the graph looks more like this:
My stats for this sample are actually pretty similar, 14/10/2.76, but my postflop play has been totally revamped and my bet sizing very much adjusted, and it makes all the difference.
Some of this is obviously the variance of poker, some of it is obviously adjustments in my play.
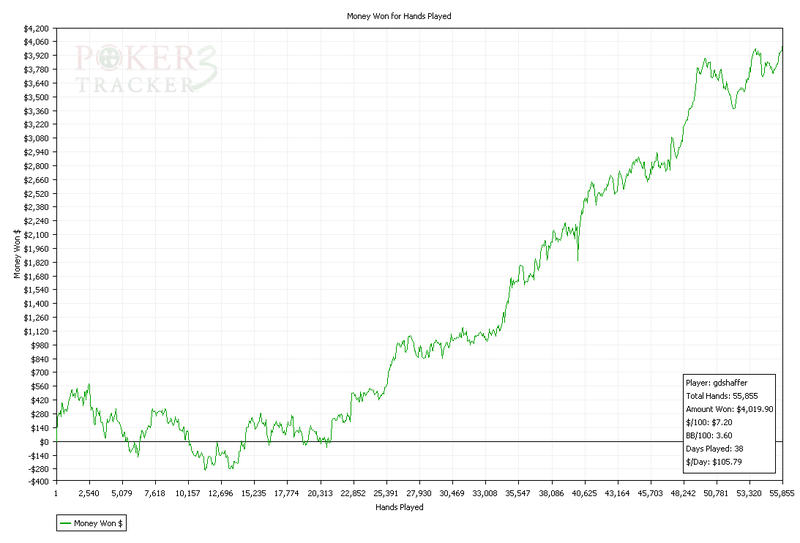
Interestingly, starting after the 20k hands of breakeven where I was playing breakeven as I adjusted to the level, and filtering out the big downswing, my graph looks like this:
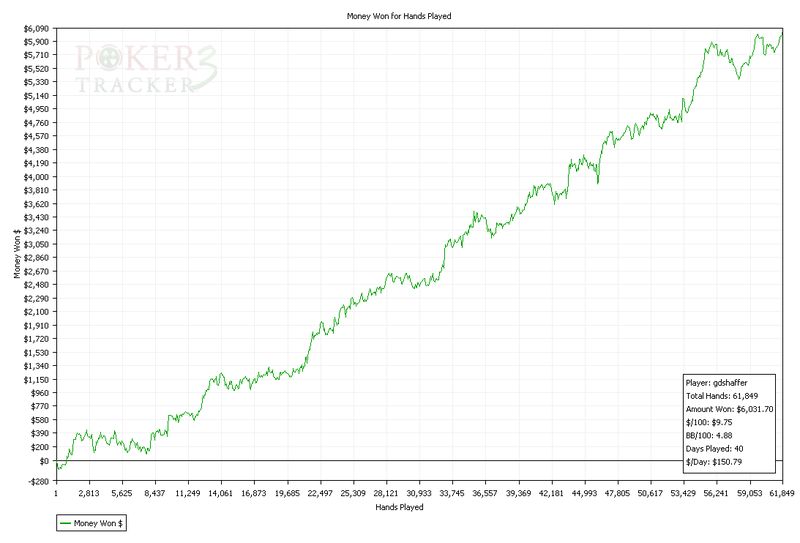
This is the summation of my sessions from 1/12 to 2/23, and then from 4/20 to present, so it's edited, but not like too selectively.
It's amazing how subtle the differences in play are between a graph that looks that fucking sweet and a graph that's just going all over the damn place.
No comments:
Post a Comment